Navigation
NASA Launching Five Earth-Observing Missions in 2014 to Obtain Crucial Data for Scientists Trying To Understand Our Changing Planet
- Argentina
- Australia
- California
- Cambodia
- Earth-Observing Missions
- France
- Greenhouse gases Observing SATellite (GOSAT)
- Japan Aerospace Exploration Agency (JAXA)
- Landsat
- Ministry of the Environment (MOE)
- Multispectral Scanner
- National Institute for Environmental Studies (NIES)
- South Korea
- Spain
- U.S. Geological Survey
- urban growth
- Biodiversity
- Desertification
- Endangered Species
- Energy
- Global Climate Change
- Water
With the launch of five Earth-observing missions in 2014 -- more Earth-focused launches in a single year in more than a decade -- NASA will be able to deliver even more crucial data to scientists trying to understand our changing planet.
With the launch of five Earth-observing missions in 2014 -- more Earth-focused launches in a single year in more than a decade -- NASA will be able to deliver even more crucial data to scientists trying to understand our changing planet.
Five new NASA Earth science missions will join Landsat 8 in space this year to expand our understanding of Earth’s changing climate and environment.
Soil Moisture Active Passive Mission
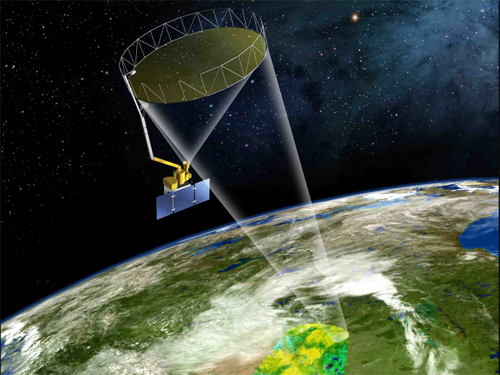 NASA's Soil Moisture Active Passive (SMAP) mission will track Earth's water into one of its last hiding places: the soil.: Soil moisture data from SMAP will aid in predictions of agricultural productivity, weather and climate. High-resolution global maps of soil moisture produced from SMAP data will inform water resource management decisions on water availability around our planet. SMAP is scheduled to launch in November 2014 from Vandenberg Air Force Base, Calif., on a Delta II rocket. The mission is managed by NASA's Jet Propulsion Laboratory in Pasadena, California. Image courtesy of NASA
Among these missions is securing data from Data from satellite sensors to show photosynthetic activity.
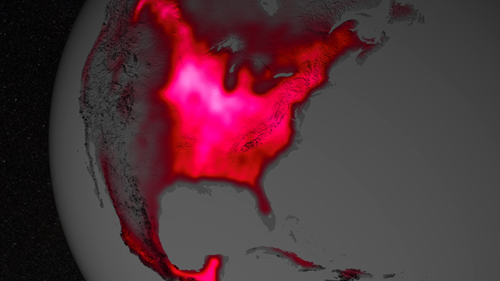 The magnitude of fluorescence portrayed in this visualization prompted researchers to take a closer look at the productivity of: The glow represents fluorescence measured from land plants in early July, over a period from 2007 to 2011. Image Credit: NASA's Goddard Space Flight Center
Satellite Shows High Productivity from U.S. Corn Belt
Data from satellite sensors show that during the Northern Hemisphere's growing season, the Midwest region of the United States boasts more photosynthetic activity than any other spot on Earth, according to NASA and university scientists.
Healthy plants convert light to energy via photosynthesis, but chlorophyll also emits a fraction of absorbed light as fluorescent glow that is invisible to the naked eye. The magnitude of the glow is an excellent indicator of the amount of photosynthesis, or gross productivity, of plants in a given region.
Research in 2013 led by Joanna Joiner, of NASA's NASA's Goddard Space Flight Center in Greenbelt, Maryland, demonstrated that fluorescence from plants could be teased out of data from existing satellites, which were designed and built for other purposes. The new research led by Luis Guanter of the Freie Universität Berlin, used the data for the first time to estimate photosynthesis from agriculture. Results were published March 25, 2014 in Proceedings of the National Academy of Sciences.
According to co-author Christian Frankenberg of NASA's Jet Propulsion Laboratory in Pasadena, Calif., "The paper shows that fluorescence is a much better proxy for agricultural productivity than anything we've had before. This can go a long way regarding monitoring – and maybe even predicting – regional crop yields."
Guanter, Joiner and Frankenberg launched their collaboration at a 2012 workshop, hosted by the Keck Institute for Space Studies at the California Institute of Technology in Pasadena, to explore measurements of photosynthesis from space. The team noticed that on an annual basis, the tropics are the most productive. But during the Northern Hemisphere's growing season, the U.S. Corn Belt "really stands out," Frankenberg said. "Areas all over the world are not as productive as this area."
The researchers set out to describe the phenomenon observed by carefully interpreting the data from the Global Ozone Monitoring Experiment 2 (GOME-2) on Metop-A, a European meteorological satellite. Data showed that fluorescence from the Corn Belt, which extends from Ohio to Nebraska and Kansas, peaks in July at levels 40 percent greater than those observed in the Amazon.
Comparison with ground-based measurements from carbon flux towers and yield statistics confirmed the results.
NASA | Satellite Shows High Productivity From U.S. Corn Belt
Data from satellite sensors show that during the Northern Hemisphere's growing season, the Midwest region of the United States boasts more photosynthetic activity than any other spot on Earth, according to NASA and university scientists. Published on April 1, 2014
The match between ground-based measurements and satellite measurements was a "pleasant surprise," said Joiner, a co-author on the paper. Ground-based measurements have a resolution of about 0.4 square miles (1 square kilometer), while the satellite measurements currently have a resolution of more than 1,158 square miles (3,000 square kilometers). The study confirms that even with coarse resolution, the satellite method could estimate the photosynthetic activity occurring inside plants at the molecular level for areas with relatively homogenous vegetation like the Corn Belt.
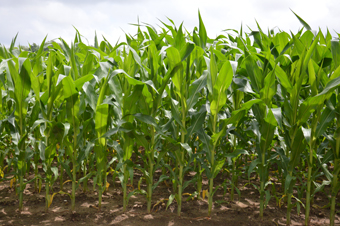 Unlike most vegetation, crops are made to perform. Frequent access to nutrients and irrigation: results in healthy, productive plants – the glow of which can be detected by satellites. Image courtesy of Wikimedia commons/IllustratedjcChallenges remain in estimating the productivity of fragmented agricultural areas, not properly sampled by current space-borne instruments. That's where missions with better resolution could help, such as NASA's Orbiting Carbon Observatory-2 – a mission planned for launch in July 2014 that will also measure solar-induced fluorescence. (Read about the OCO-2 in the Horizon International Solutions Site article, NASA’s OCO-2 Brings Sharp New Focus on Global Carbon.
The research could also help scientists improve the computer models that simulate Earth's carbon cycle, as Guanter found a strong underestimation of crop photosynthesis in models. The analysis revealed that carbon cycle models – which scientists use to understand how carbon cycles through the ocean, land and atmosphere over time – underestimate the productivity of the Corn Belt by 40 to 60 percent.
Unlike most vegetation, food crops are managed to maximize productivity. They usually have access to abundant nutrients and are irrigated. The Corn Belt, for example, receives water from the Mississippi River. Accounting for irrigation is currently a challenge for models, which is one reason why they underestimate agricultural productivity.
"If we don't take into account irrigation and other human influences in the agricultural areas, we're not going to correctly estimate the amount of carbon taken up by vegetation, particularly corn," Joiner said. "Corn plants are very productive in terms of assimilating carbon dioxide from the atmosphere. This needs to be accounted for going forward in trying to predict how much of the atmospheric carbon dioxide will be taken up by crops in a changing climate."
According to Frankenberg, the remote sensing-based techniques now available could be a powerful monitoring tool for food security, especially data from OCO-2 and in combination with data from other upcoming satellites, such as NASA's Soil Moisture Active Passive, scheduled for launch later this year.
NASA monitors Earth's vital signs from land, air and space with a fleet of satellites and ambitious airborne and ground-based observation campaigns. NASA develops new ways to observe and study Earth's interconnected natural systems with long-term data records and computer analysis tools to better see how our planet is changing. The agency shares this unique knowledge with the global community and works with institutions in the United States and around the world that contribute to understanding and protecting our home planet.
Urban growth, South Korea
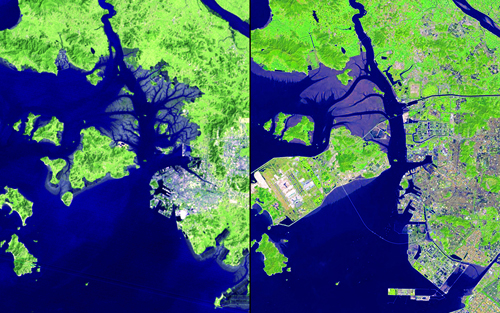 The shoreline area of Incheon, South Korea, has changed dramatically over the past 32 years.: Marsh areas have been turned into usable land and urban development has expanded. Islands have been connected to accommodate Incheon International Airport, which opened in 2001 and is now one of the largest and busiest in the world. The new Incheon Bridge (also called the Incheon Grand Bridge), which opened in October 2009, is visible in the 2013 image. Images taken by the Multispectral Scanner onboard Landsat 2 and the Operational Land Imager onboard Landsat 8. Source: U.S. Geological Survey (USGS) Landsat Missions Gallery "32 Years of Change: Incheon, South Korea," U.S. Department of the Interior / USGS and NASA.
Flood in Cambodia
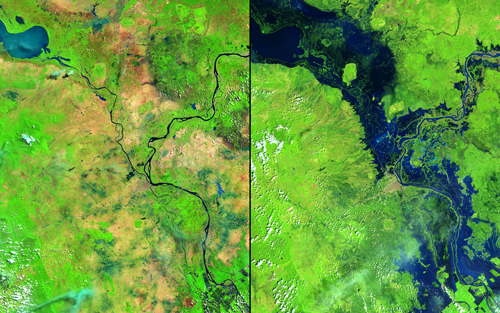 In October 2013, Typhoon Nari followed heavy seasonal rains to create substantial flooding along the Mekong and Tonlé Sap Rivers: in Cambodia. The flood affected more than a half million people, and more than 300,000 hectares (about three-quarters of a million acres) of rice fields are believed to have been destroyed. The capital city of Phnom Penh is just south of the image center. Images taken by the Operational Land Imager onboard Landsat 8. Source: U.S. Geological Survey (USGS) Landsat Missions Gallery"Flooding in Cambodia," U.S. Department of the Interior / USGS and NASA.
Flooding in France
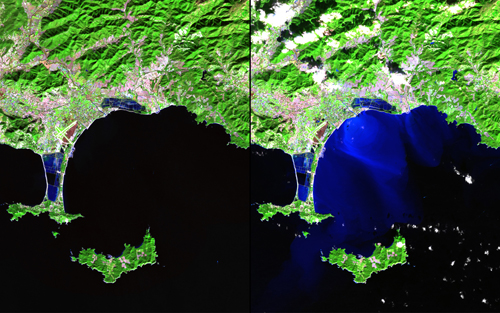 In mid-January 2014, unusually heavy rain in southeast France led to flooding, landslides and: evacuations. Up to 20 centimeters (8 inches) of rain fell over three days, far exceeding the typical monthly totals. These images show the area around Hyères, along with the Giens Peninsula and nearby islands. The bright blue colors in the right-hand image show the flow of sediment-rich floodwaters into the Mediterranean Sea. Images taken by the Operational Land Imager onboard Landsat 8. Source: U.S. Geological Survey (USGS) Landsat Missions Gallery"Effects of Flooding: Hyères, France," U.S. Department of the Interior / USGS and NASA.
Fire in Australia
 Wyperfeld National Park in southeastern Australia contains native shrubland (the Australian "bush"): that appears dark red in these images. Fires occur in the park almost every year. They leave huge scars of bright, bared earth that quickly regrows. A stark change is visible here from unburned bush in 1975 to huge burn scars in the later images. Images taken by Landsat 2, 5 and 7. Source: Earthshots: Satellite Images of Environmental Change, "Wyperfeld National Park," U.S. Geological Survey.
Cuesta del Viento Reservoir, Argentina
Surrounded by spectacular mountains, the reservoir controls the flow of streams from snowmelt of the Andes Mountains and provides a source of irrigation for fruit plantations and other crops. The reservoir has also become a popular destination for windsurfing and kite surfing because of the consistent afternoon winds that reach 30–40 knots (55–74 km/hour; 34–46 mi/hour). These powerful winds are caused by the daily flow of air currents that travel out of the eastern Andes Mountains and converge in the river valley.
These Landsat images show the area in November 1996 (before the dam was built) on the left, and in December 2013. The inclusion of Landsat’s shortwave infrared band information for this image pair also highlights the geologic features of the area.
Landsat images provide an unbiased view of features on the Earth’s surface and the changes that take place on the landscape.
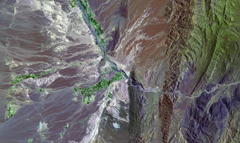 The Cuesta del Viento (Wind Slope) Reservoir formed behind a large dam that was constructed on the: Jáchal River in 1997–1998 in the northeastern San Juan Province of Argentina.
 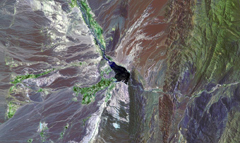 The Cuesta del Viento (Wind Slope) Reservoir in 2013
Solar power growth in Spain
.jpg) In March 2009, Andasol-1 in southern Spain became the first solar thermal collector station in Europe.: Andasol-2 and Andasol-3 were added in 2009 and 2011. In contrast to photovoltaic systems, these parabolic trough power plants store the sun's energy in a "heat reservoir" of molten salt and generate electricity for up to 200,000 people via thermal turbines. Water from the nearby Sierra Nevada mountain range cools the system. Images taken by the Thematic Mapper onboard Landsat 5 and the Operational Land Imager onboard Landsat 8. Source: U.S. Geological Survey (USGS) Landsat Missions Gallery "Andasol Solar Power Stations," U.S. Department of the Interior / USGS and NASA.
In March 2009, Andasol-1 in southern Spain became the first solar thermal collector station in Europe.: Andasol-2 and Andasol-3 were added in 2009 and 2011. In contrast to photovoltaic systems, these parabolic trough power plants store the sun's energy in a "heat reservoir" of molten salt and generate electricity for up to 200,000 people via thermal turbines. Water from the nearby Sierra Nevada mountain range cools the system. Images taken by the Thematic Mapper onboard Landsat 5 and the Operational Land Imager onboard Landsat 8. Source: U.S. Geological Survey (USGS) Landsat Missions Gallery "Andasol Solar Power Stations," U.S. Department of the Interior / USGS and NASA.
 NASA Selfie Event NASA Celebrates Earth Day with "Global Selfie" Event
For the first time in more than a decade, five NASA Earth-observing missions will be launched into space in a single year. To celebrate this milestone, NASA is inviting people all around the world to step outside on Earth Day, April 22, take a "selfie," and share it with the world on social media.
The article above, "Satellite Shows High Productivity from U.S. Corn Belt," was published by NASA March 31, 2014.
This article was published on the Horizon International Solutions Site on 4 April 2014.
Search
Latest articles
Agriculture
- World Water Week: Healthy ecosystems essential to human health: from coronavirus to malnutrition Online session Wednesday 24 August 17:00-18:20
- World Water Week: Healthy ecosystems essential to human health: from coronavirus to malnutrition Online session Wednesday 24 August 17:00-18:20
Air Pollution
- "Water and Sanitation-Related Diseases and the Changing Environment: Challenges, Interventions, and Preventive Measures" Volume 2 Is Now Available
- Global Innovation Exchange Co-Created by Horizon International, USAID, Bill and Melinda Gates Foundation and Others
Biodiversity
- It is time for international mobilization against climate change
- World Water Week: Healthy ecosystems essential to human health: from coronavirus to malnutrition Online session Wednesday 24 August 17:00-18:20
Desertification
- World Water Week: Healthy ecosystems essential to human health: from coronavirus to malnutrition Online session Wednesday 24 August 17:00-18:20
- UN Food Systems Summit Receives Over 1,200 Ideas to Help Meet Sustainable Development Goals
Endangered Species
- Mangrove Action Project Collaborates to Restore and Preserve Mangrove Ecosystems
- Coral Research in Palau offers a “Glimmer of Hope”
Energy
- Global Innovation Exchange Co-Created by Horizon International, USAID, Bill and Melinda Gates Foundation and Others
- Wildlife Preservation in Southeast Nova Scotia
Exhibits
- Global Innovation Exchange Co-Created by Horizon International, USAID, Bill and Melinda Gates Foundation and Others
- Coral Reefs
Forests
- NASA Satellites Reveal Major Shifts in Global Freshwater Updated June 2020
- Global Innovation Exchange Co-Created by Horizon International, USAID, Bill and Melinda Gates Foundation and Others
Global Climate Change
- It is time for international mobilization against climate change
- It is time for international mobilization against climate change
Global Health
- World Water Week: Healthy ecosystems essential to human health: from coronavirus to malnutrition Online session Wednesday 24 August 17:00-18:20
- More than 400 schoolgirls, family and teachers rescued from Afghanistan by small coalition
Industry
- "Water and Sanitation-Related Diseases and the Changing Environment: Challenges, Interventions, and Preventive Measures" Volume 2 Is Now Available
- Global Innovation Exchange Co-Created by Horizon International, USAID, Bill and Melinda Gates Foundation and Others
Natural Disaster Relief
- STOP ATTACKS ON HEALTH CARE IN UKRAINE
- Global Innovation Exchange Co-Created by Horizon International, USAID, Bill and Melinda Gates Foundation and Others
News and Special Reports
- World Water Week: Healthy ecosystems essential to human health: from coronavirus to malnutrition Online session Wednesday 24 August 17:00-18:20
- STOP ATTACKS ON HEALTH CARE IN UKRAINE
Oceans, Coral Reefs
- World Water Week: Healthy ecosystems essential to human health: from coronavirus to malnutrition Online session Wednesday 24 August 17:00-18:20
- Mangrove Action Project Collaborates to Restore and Preserve Mangrove Ecosystems
Pollution
- Zakaria Ouedraogo of Burkina Faso Produces Film “Nzoue Fiyen: Water Not Drinkable”
- "Water and Sanitation-Related Diseases and the Changing Environment: Challenges, Interventions, and Preventive Measures" Volume 2 Is Now Available
Population
- "Water and Sanitation-Related Diseases and the Changing Environment: Challenges, Interventions, and Preventive Measures" Volume 2 Is Now Available
- "Water and Sanitation-Related Diseases and the Changing Environment: Challenges, Interventions, and Preventive Measures" Volume 2 Is Now Available
Public Health
- Honouring the visionary behind India’s sanitation revolution
- Honouring the visionary behind India’s sanitation revolution
Rivers
- World Water Week: Healthy ecosystems essential to human health: from coronavirus to malnutrition Online session Wednesday 24 August 17:00-18:20
- Mangrove Action Project Collaborates to Restore and Preserve Mangrove Ecosystems
Sanitation
- Honouring the visionary behind India’s sanitation revolution
- Honouring the visionary behind India’s sanitation revolution
Toxic Chemicals
- "Water and Sanitation-Related Diseases and the Changing Environment: Challenges, Interventions, and Preventive Measures" Volume 2 Is Now Available
- Actions to Prevent Polluted Drinking Water in the United States
Transportation
- "Water and Sanitation-Related Diseases and the Changing Environment: Challenges, Interventions, and Preventive Measures" Volume 2 Is Now Available
- Urbanization Provides Opportunities for Transition to a Green Economy, Says New Report
Waste Management
- Honouring the visionary behind India’s sanitation revolution
- Honouring the visionary behind India’s sanitation revolution
Water
- Honouring the visionary behind India’s sanitation revolution
- Honouring the visionary behind India’s sanitation revolution
Water and Sanitation
- Honouring the visionary behind India’s sanitation revolution
- Honouring the visionary behind India’s sanitation revolution

